VWAP Explained: What It Is & How to Trade It
Ask a desk trader where "fair value" is for the session and they'll often glance at one line: VWAP. The Volume Weighted Average Price is the single most-watched intraday benchmark in futures — the level institutions measure their fills against and the line price keeps gravitating back to. Learn to read it and you always know whether buyers or sellers are winning the day. This guide is written for futures traders on NinjaTrader 8.
What is VWAP?
VWAP stands for Volume Weighted Average Price. It's the average price a market has traded at over a period — but weighted by volume, so prices where a lot of contracts changed hands count more than prices that barely traded. The result is a single line that represents the session's true average cost basis: where the "average" buyer and seller actually did business.
Most intraday VWAP resets at the start of each session (it's anchored to the open) and then builds through the day as volume comes in. Early on it moves quickly; as the session fills with volume it settles and becomes harder to shift — which is exactly why it works as a stable fair-value reference the longer the day goes.
VWAP vs a moving average
VWAP looks like a moving average on the chart, but it answers a different question. A simple moving average weights every bar the same, no matter how much traded. VWAP weights each price by its volume, so a heavy-volume price pulls the line toward it and a quiet drift barely moves it. And where a moving average rolls continuously across days, VWAP typically resets each session. In short: a moving average smooths price; VWAP marks fair value.
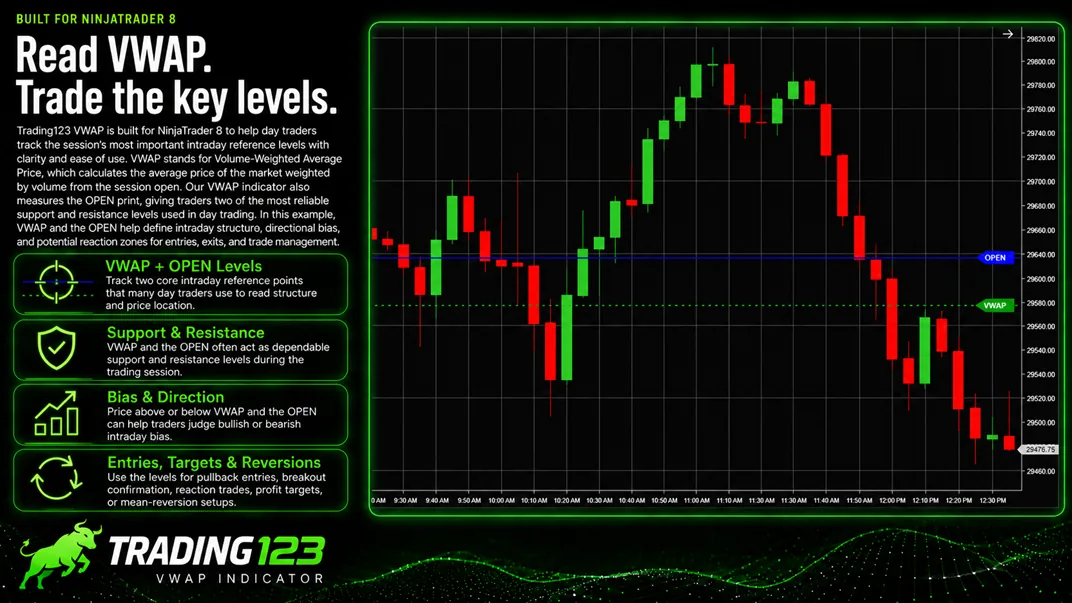
VWAP bands — the standard-deviation lines
On its own, VWAP is one line. Add the standard-deviation bands and it becomes a full fair-value map. The bands are plotted at 1, 2 and (sometimes) 3 standard deviations above and below VWAP, measuring how stretched price is from the volume-weighted average:
- Inside the ±1σ band — price is near fair value; the market is balanced.
- At the ±2σ band — price is getting extended; in a range, these outer bands often act as reversion zones.
- Riding a band — in a strong trend, price can hug the upper (or lower) band for hours; that's a sign of one-sided control, not an automatic fade.
How to trade VWAP
A handful of repeatable ideas come straight off the VWAP line:
- VWAP as a bias line — price above VWAP = buyers in control (favor longs); price below VWAP = sellers in control (favor shorts). Many traders simply won't fight the side of VWAP price is on.
- Pullback to VWAP — in a trend, price often dips back to VWAP and resumes. Buying pullbacks to VWAP in an uptrend (or selling rallies to it in a downtrend) gives a defined entry with a tight stop on the other side of the line.
- Band reversion — in a balanced/range session, a push to the +2σ or −2σ band that stalls can be faded back toward VWAP.
- VWAP reclaim / loss — price reclaiming VWAP after being below it (or losing it after being above) is a momentum shift worth watching, especially around the open or a news release.
Anchored VWAP
Standard VWAP anchors to the session open, but you can anchor it to any significant point — a prior swing high or low, a gap, an earnings bar, or a news spike. An anchored VWAP measures the average cost basis of everyone who's traded since that event, which makes it a powerful support/resistance line: it shows whether buyers or sellers from that moment are now in profit or underwater.
A worked example on the NQ
Say the NQ opens and trends up through the morning, holding above a rising VWAP. Price extends to the +2σ band, pauses, then pulls back.
- Trend pullback: price dips from the +2σ band down to VWAP, holds, and turns back up → potential long in the direction of the trend, stop just below VWAP, first target back at the +1σ or +2σ band.
- Loss of VWAP: instead, price breaks and holds below VWAP on rising volume → the bias has flipped; longs stand aside and shorts look for rallies back to VWAP to sell.
Either way, VWAP gave you an objective line for the entry, the stop, and the bias — before you risked a dollar. (Illustration only — not a recommendation or a past result.)
Why VWAP matters
VWAP isn't just a retail indicator — it's the benchmark institutions use to judge execution quality. A fund buying a large position wants to fill at or below VWAP; a seller wants to fill at or above it. Because so much real size is measured against it, VWAP becomes a self-reinforcing magnet: the level everyone is watching tends to be the level price respects.
Common mistakes
- Blindly fading the bands — in a strong trend price can ride the outer band; the bands are context, not an automatic reversal signal.
- Trusting VWAP too early — in the first few minutes, with little volume in, VWAP is jumpy; it firms up as the session fills.
- Ignoring the side of VWAP — taking longs below VWAP (or shorts above it) means fighting the session's control.
- Only using the session VWAP — an anchored VWAP from a key high/low often gives a cleaner level for a specific move.
Plotting VWAP automatically
You don't want to calculate a volume-weighted average and three deviation bands by hand. Our VWAP indicator for NinjaTrader 8 plots VWAP and its standard-deviation bands automatically, anchored to the session, so the fair-value benchmark is always on your chart. It pairs naturally with our Volume Profile indicator for a complete read on where value is building.
Frequently asked questions
What is VWAP?
VWAP stands for Volume Weighted Average Price — the average price a market has traded at over a period, weighted by volume. Because it factors in how much traded at each price, it reflects the session's true average cost basis better than a simple moving average, and it's widely used as a fair-value benchmark.
How do you trade VWAP?
Common approaches: trade pullbacks to VWAP in the direction of the trend (buy dips to VWAP in an uptrend, sell rallies to it in a downtrend); treat VWAP as a bias line (above it is bullish, below it is bearish); and fade the outer standard-deviation bands back toward VWAP in a range. Price above or below VWAP tells you which side is in control.
What are VWAP bands?
VWAP bands are standard-deviation lines plotted above and below VWAP, usually at 1, 2 and 3 deviations. They show how far price has stretched from the volume-weighted average — the outer bands often act as overextension zones where price tends to revert back toward VWAP.
What's the difference between VWAP and a moving average?
A simple moving average weights every bar equally. VWAP weights each price by the volume traded there, so heavily traded prices pull it more. VWAP also typically resets each session (anchored to the open), whereas a moving average rolls continuously — making VWAP a session fair-value benchmark rather than a smoothing line.
Can VWAP be plotted automatically on NinjaTrader 8?
Yes — the Trading123 VWAP indicator plots VWAP and its standard-deviation bands automatically on your NinjaTrader 8 chart, with session anchoring, so you always have the fair-value benchmark in front of you.
Key takeaways
- VWAP is the volume-weighted average price — the session's fair-value benchmark.
- Above VWAP = buyers in control; below = sellers. It's a bias line first.
- Trade pullbacks to VWAP with the trend; fade the outer ±2σ bands in a range.
- An indicator plots VWAP + its bands automatically — no manual math.
Want VWAP + bands on your charts?
Our VWAP indicator plots VWAP and its standard-deviation bands on NinjaTrader 8 automatically, anchored to the session — so the fair-value benchmark is always in front of you.
Get VWAP on your chartsEducational disclaimer: This article is for educational purposes only and is not financial advice or a recommendation to trade. Futures trading involves substantial risk of loss and is not suitable for every investor. Past performance is not indicative of future results.