Crude oil Levels Indicator NinjaTrader

Crude Oil levels

Crude Oil Levels Indicator (CL Futures)

Key Levels Crude Oil (CL) Daily Price Levels Support & Resistance

Daily key levels that highlight where Crude Oil is most likely to react

The Crude Oil Levels indicator is designed specifically for Crude Oil (CL) futures. This indicator serves as a road map for the day’s Crude Oil price action — plotting levels that act as decision points for traders. These levels help you measure directional bias, confirm trend strength, and locate price areas where institutional activity tends to cluster.

  • Overnight High & Low Levels: Instantly see the levels that often guide the next session.
  • Market Directional Bias: Determine whether the session is leaning bullish or bearish based on structure.
  • Reversal & Breakout Zones: Identify probable turning points and key breakout areas and targets.
  • Targets & Decision Points: Use levels for targets, entries, and risk placement.
  • Pairs Well with Other Tools: Works great with VWAP, Fibonacci levels, and EMA trend filters.

CL Chart Example: Overnight Levels Mapped for the Session

Below is a real Crude Oil (CL) chart showing how the Crude Oil Levels indicator plots overnight-derived support and resistance zones. These levels often act as intraday decision points for reversals, breakouts, and directional bias.
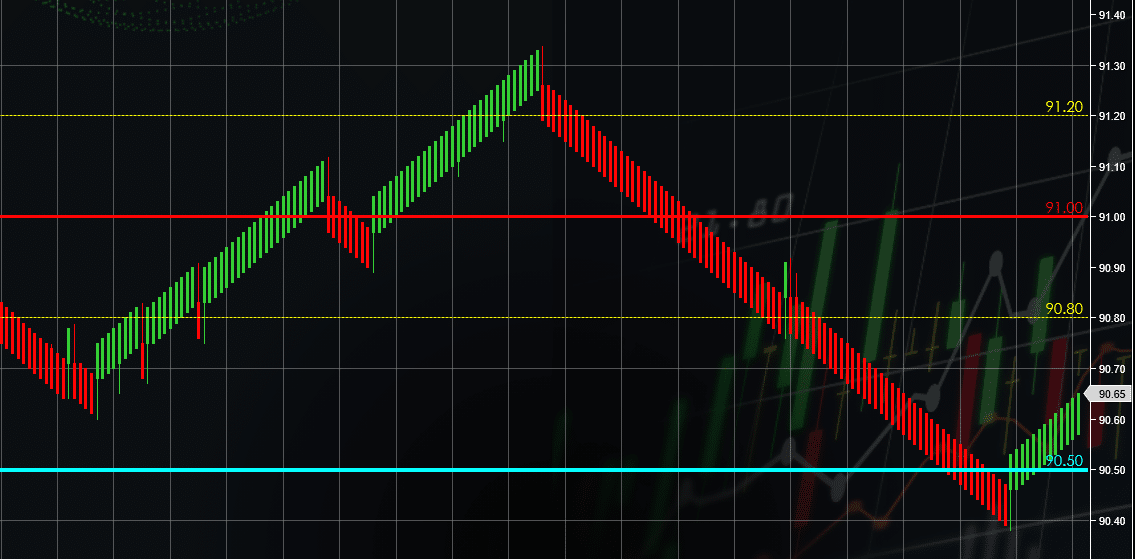
Crude Oil Levels indicator showing overnight levels on CL futures Key Levels
These plotted levels provide structure for intraday decisions — helping traders anticipate where price may reverse, break out, or pause.
🌙

Blue Lines Range Levels

The indicator analyzes several days of data from overnight high and low — key price points that often drive the next day’s action.

📍

Red Lines Major Support Zones

These levels frequently act as reversal zones, breakout triggers, and institutional reaction points.

🎯

Yellow Lines

These are entry zones and structure for the session.

🧭

Directional Bias

Price holding above any line? or breaking below support helps determine the daily bullish/bearish bias.

Why Traders Use Crude Oil Levels


  • Provides a daily roadmap for Crude Oil
  • Highlights high-probability reaction zones
  • Removes the need to manually draw lines
  • Patterns repeat daily
  • Strong support and resistance levels
  • Trade the price action


Crude Levels

Key Features: Crude Oil Levels

Built specifically for Crude Oil (CL) futures, this indicator plots key overnight-derived support and resistance levels so you can trade the session with structure, clarity, and confidence.

🌙

Overnight Session Levels

Automatically plots the overnight high and low — levels that often influence price direction after the open.

🧭

Daily Directional Bias

Helps determine whether the session is leaning bullish or bearish by showing how price reacts around key levels.

🎯

Targets & Decision Zones

Use plotted levels as objective price targets, reaction zones, and decision points for your trade plan.

Reversal & Breakout Areas

Highlights likely reversal and breakout zones where institutional order flow often clusters around structure.

📈

Trend Confirmation Support

Combines perfectly with VWAP, Fibonacci levels, and EMAs to confirm trend strength or exhaustion.

🧠

Road Map for CL Price Action

Gives traders a structured framework for intraday CL trading — ideal for both manual trading and automation.

How the Crude Oil Levels Indicator Works

The Crude Oil Levels indicator automatically analyzes the overnight session and plots key support and resistance levels for the next trading day. These levels become your intraday road map — helping you anticipate price movement, identify reaction zones, and plan trades with confidence.

🌙

Step 1 — Read the Overnight Session

The indicator tracks the overnight trading range and detects key reference points such as the overnight high and low — price areas that often influence the next session’s direction.

📍

Step 2 — Plot Key Levels Automatically

Once the session transitions, the tool plots overnight-derived levels directly on your chart — giving you objective support and resistance zones without manual drawing.

🧭

Step 3 — Use the Levels as a Daily Road Map

Traders use these plotted decision points to identify probable reversal zones, breakout targets, and trend confirmation areas throughout the day — especially when combined with VWAP, EMAs, or Fibonacci tools.

  • Overnight levels help anticipate the most likely reaction points during the day session.
  • Use levels as trade targets, breakout zones, stop placement areas, and trend confirmation filters.
  • Ideal for both manual traders and automated systems that rely on structure-based decision points.

Still Have Questions?

If you have any questions about installation, settings, or using the Crude Oil Levels indicator on NinjaTrader 8, our support team is ready to help. Tap the chat icon in the corner of this page for instant assistance — we’ll walk you through setup and make sure everything works smoothly.

💬

Live Chat Help

Tap the chat icon on this page to connect with our team. We respond fast and help you get back to trading.

📧

Email Support

Prefer email? Reach out any time and we’ll assist with installation, settings, or troubleshooting.

info@trading123.net
📞

Phone Support

Need help quickly? Call us during market hours for real guidance from traders who understand NinjaTrader.

Call Support

NINJATRADER 8 INDICATOR

Crude Oil Levels for NinjaTrader 8

Daily key levels that highlight where CL is most likely to react.

Crude Oil Levels automatically plots high-importance daily price levels so you can quickly identify potential reaction zones, structure, and decision points — without clutter.

  • Plots important daily market structure levels automatically
  • Helps identify potential support / resistance reaction areas
  • Designed for clarity — minimal, readable, and non-intrusive
  • Works across all timeframes (scalping to swing context)
  • Built specifically for NinjaTrader 8
Instant download • NT8 compatible • All Sales are Final No refunds or returns
Crude Oil Levels indicator screenshot on NinjaTrader 8
Daily levels plotted automatically on your CL chart.