Why Traders Use Fair Value Gaps
- Find High Probability Entry Points
- Highlights high-probability reaction zones
- Tracking Smart Money
- Manage Risk Safely
- Set Precise Profit Targets
Daily key levels Fair Value Gaps - Market Reaction react
The Fair Value Gaps indicator is designed specifically for trading futures. This indicator serves as a road map for the day’s price action — plotting levels that act as decision points for traders. These levels help you measure directional bias, confirm trend strength, and locate price areas where institutional activity tends to cluster. Use on any chart type.
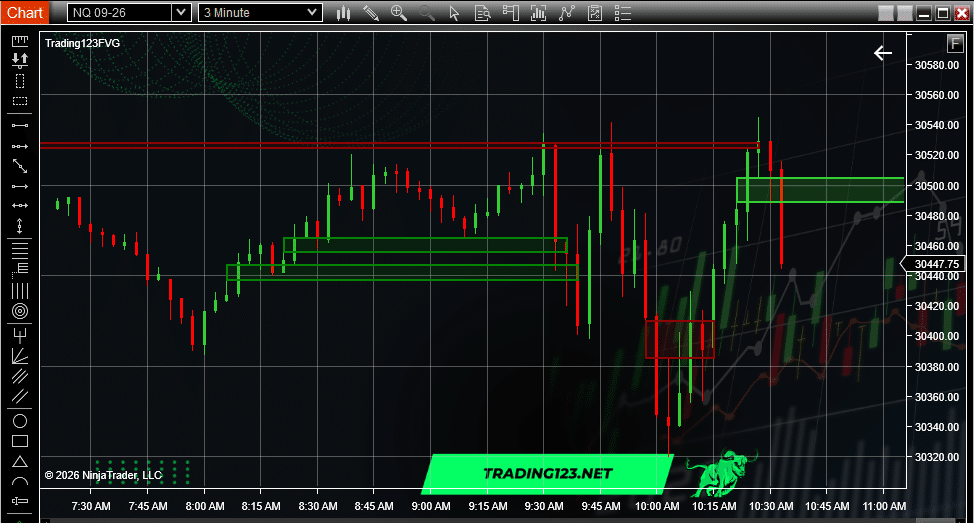
Below is a chart showing how the Fair Value Gap indicator plots the daily reference points which are institutional price levels.
Key Levels
The indicator uses AI to identify key price points that often drive the day’s action.
These levels frequently act as reversal zones, breakout triggers, and institutional reaction points.
These are support levles for the session and entry zones.
🔒 Secure Payment 💻 Instant Download 🔒 New License System – No Machine ID Needed 🔁 Lifetime Free Updates ⚡All Sales Final
If you have any questions about installation, settings, or using the Fair Value Gap indicator for NinjaTrader 8, our support team is ready to help. Tap the chat icon in the corner of this page for instant assistance — we’ll walk you through setup and make sure everything works smoothly.
Tap the chat icon on this page to connect with our team. We respond fast and help you get back to trading.
Prefer email? Reach out any time and we’ll assist with installation, settings, or troubleshooting.
info@trading123.netNeed help quickly? Call us during market hours for real guidance from traders who understand NinjaTrader.
Call SupportWhen trading futures, Fair Value Gaps (FVGs) serve as a high probality entry zones. Futures markets are highly mechanized and heavily algoritmic. High frequency algorithms drive equidity index futures like Emini S & P and Emina Nasdaq 100 to constantly seek out these precise price imbalances to balance market liquidity.
These levels represent areas where significant buying and selling activity occurs, that use AI technology to monitor the levels.
Markets treat FVGs like liquidity vacuums. Price will naturally tend to drift back into an unfilled FVG to balance out the inefficiency.
Use plotted levels as objective price targets, reaction zones, and decision points for your trade plan.
Highlights likely reversal and breakout zones where institutional order flow often clusters around structure.
Algorithms frequently drive price 75% to 90% into FVG, to hunt retails stops.
Gives traders a structured framework for intraday trading — ideal for both manual trading and automation.