
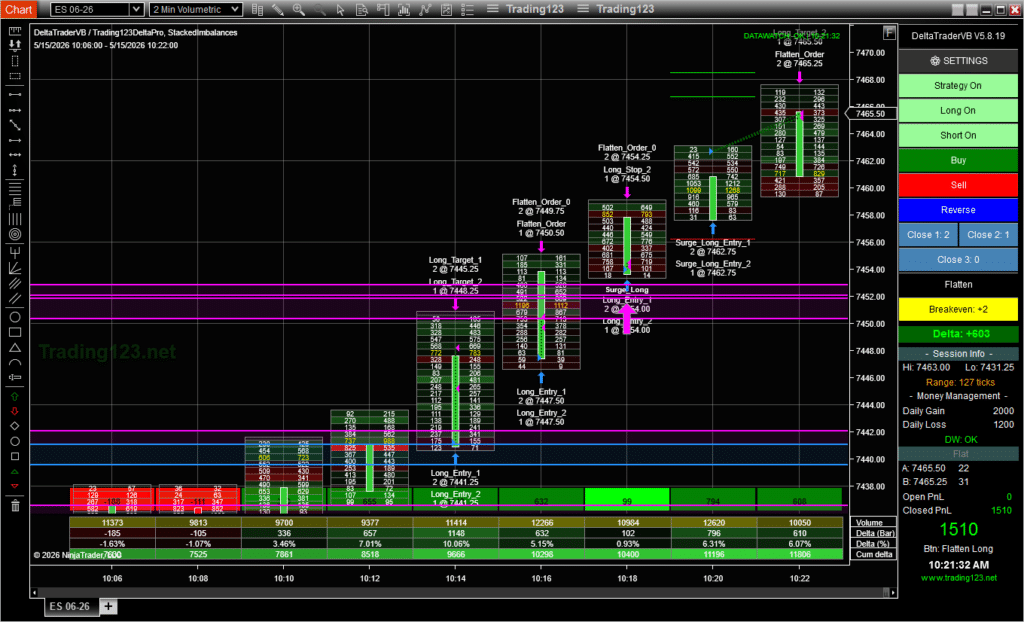
Volume delta is the difference between the volume traded at the ask price (aggressive buying) and the volume traded at the bid price (aggressive selling) over a given period. A positive volume delta means aggressive buyers dominated; a negative volume delta means aggressive sellers dominated. Traders use volume delta to see who is actually in control of a market in real time, rather than inferring it from price alone.
This guide explains what volume delta is, how it is calculated, how traders use it, and how it differs from traditional volume and other order flow tools.
Volume delta measures the net difference between aggressive buying and aggressive selling. Every executed trade in the futures market happens at either the bid or the ask. A trade executed at the ask is initiated by a buyer willing to pay up, and a trade executed at the bid is initiated by a seller willing to sell down. Volume delta adds up the ask-side volume, subtracts the bid-side volume, and reports the difference.
For example, if 1,200 contracts trade at the ask and 800 contracts trade at the bid during a bar, the volume delta for that bar is +400. This indicates aggressive buyers were more active than aggressive sellers during that period.
Volume delta is calculated with a simple formula:
Volume Delta = Ask Volume − Bid Volume
Calculating volume delta accurately requires tick-level market data that records whether each trade occurred at the bid or the ask. This is why order flow tools need a data feed that supports bid/ask tick data, such as Rithmic or CQG Continuum, rather than a basic delayed or aggregated feed.
Volume delta matters because price alone does not tell you the strength behind a move. Two bars can close at the same price while one was driven by aggressive buyers and the other by aggressive sellers. Volume delta exposes that hidden pressure.
Traders use volume delta to:
Regular volume tells you how much traded. Volume delta tells you who traded—buyers or sellers.
| Metric | What it shows | What it misses |
|---|---|---|
| Regular volume | Total contracts traded in a period | Direction of aggression (buy vs. sell) |
| Volume delta | Net difference between aggressive buying and selling | Total participation if viewed alone |
Standard volume bars treat a heavy-buying bar and a heavy-selling bar identically if the total contract count is the same. Volume delta separates the two, which is why order flow traders rely on it for directional insight.
Cumulative volume delta is the running total of volume delta across multiple bars or an entire session. While a single bar’s delta shows short-term pressure, cumulative delta reveals the larger trend of buying versus selling over time.
Traders watch cumulative volume delta for divergences against price. When price trends up but cumulative delta flattens or declines, it suggests the rally is not supported by aggressive buying and may be vulnerable to reversal.
Volume delta is based on completed transactions, so it does not lag the way moving averages or oscillators do, and it does not repaint once a trade has printed. Each trade is recorded at the bid or ask as it happens, and that record does not change retroactively. This is one reason order flow traders consider volume delta a more direct read of market activity than derived, price-based indicators.
It is worth noting that the accuracy of volume delta depends entirely on the quality of the underlying tick data. A feed that aggregates or approximates trade classification can produce a less reliable delta than a true tick-by-tick feed.
Volume delta works best in centralized, high-liquidity futures markets where bid/ask tick data is reliable and consistent. The E-mini S&P 500 (ES) and Micro E-mini S&P 500 (MES) are among the most popular markets for order flow analysis because of their deep liquidity and clean, continuous tick data.
Volume delta is less reliable in fragmented or decentralized markets, such as spot forex, where there is no single consolidated tape recording every transaction at the bid or ask.
Automated order flow strategies use volume delta as a quantifiable input for trade decisions. Instead of a trader manually reading the delta, the strategy applies rules to the live delta data—entering, exiting, and managing positions when specific order flow conditions are met, such as a strong shift in delta, a divergence against price, or signs of seller exhaustion.
The Trading123 Order Flow Strategy for NinjaTrader 8 is one example of an automated approach built around volume delta. It reads the imbalance between aggressive buyers and sellers on ES and MES futures and handles entries, exits, stop losses, trailing stops, and profit targets automatically based on order flow rules.
Is volume delta the same as order flow? No. Order flow is the broader study of how buy and sell orders interact in a market. Volume delta is one specific metric within order flow analysis that measures net aggressive buying versus selling.
Can volume delta predict reversals? Volume delta can highlight conditions that often precede reversals, such as divergence between price and delta or exhaustion after a large delta spike. It signals shifting pressure rather than guaranteeing any outcome.
What data feed do I need to use volume delta? You need a data feed that provides bid/ask tick data, such as Rithmic or CQG Continuum. Feeds that only provide aggregated or delayed data cannot calculate accurate volume delta.
Does volume delta work on stocks? Volume delta can be applied to stocks that have reliable tick data, but it is most commonly used in futures markets like the ES, where the consolidated tape provides clean, consistent bid/ask information.
Disclaimer: Futures trading carries substantial risk of loss and is not suitable for all investors. Past performance is not indicative of future results. This content is for educational purposes only and is not financial advice.